Back to projects

Project case study

Genome curation

Predicting neighbouring genome fragments and the ends that connect them, using contact images and graph learning.

This project is part of my collaboration with Tree of Life, through my work at the Wellcome Sanger Institute.

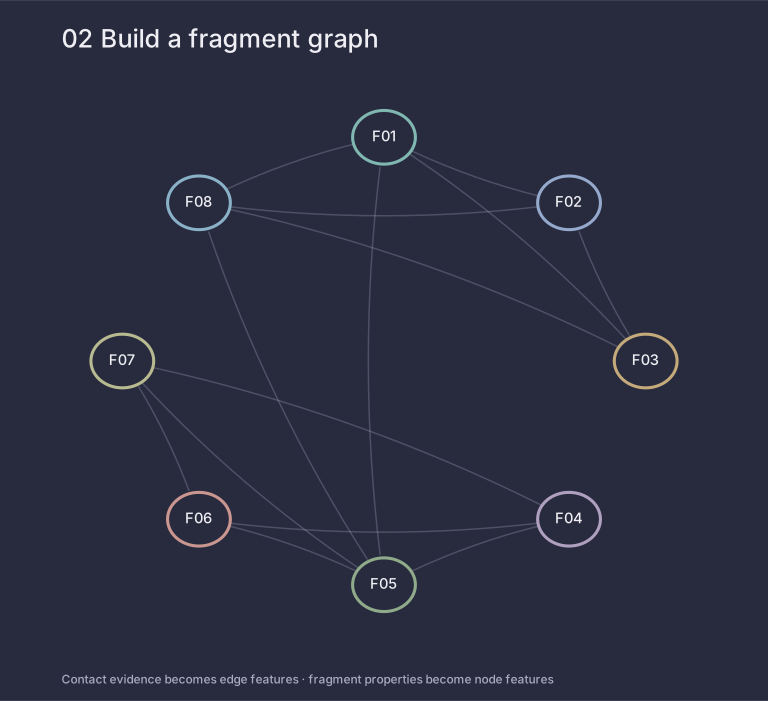
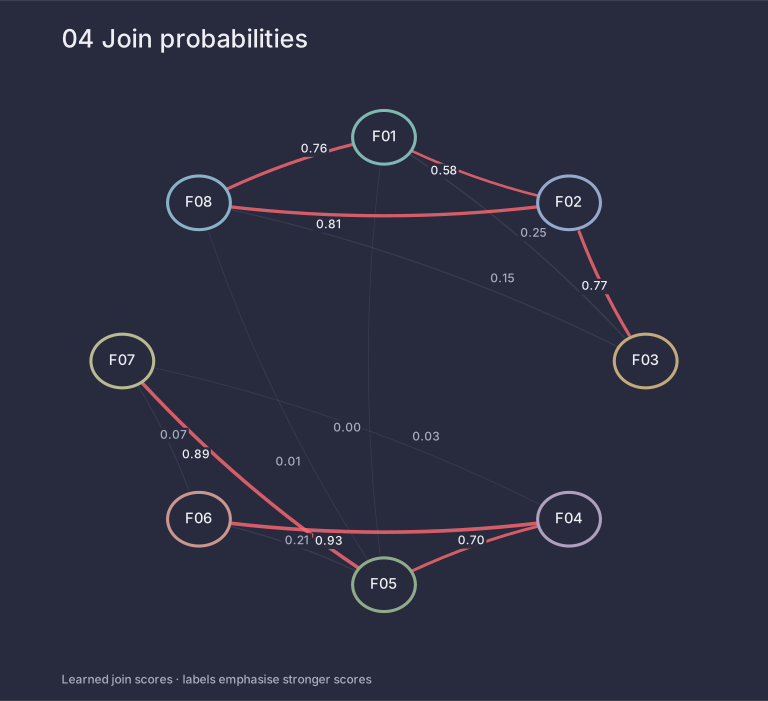
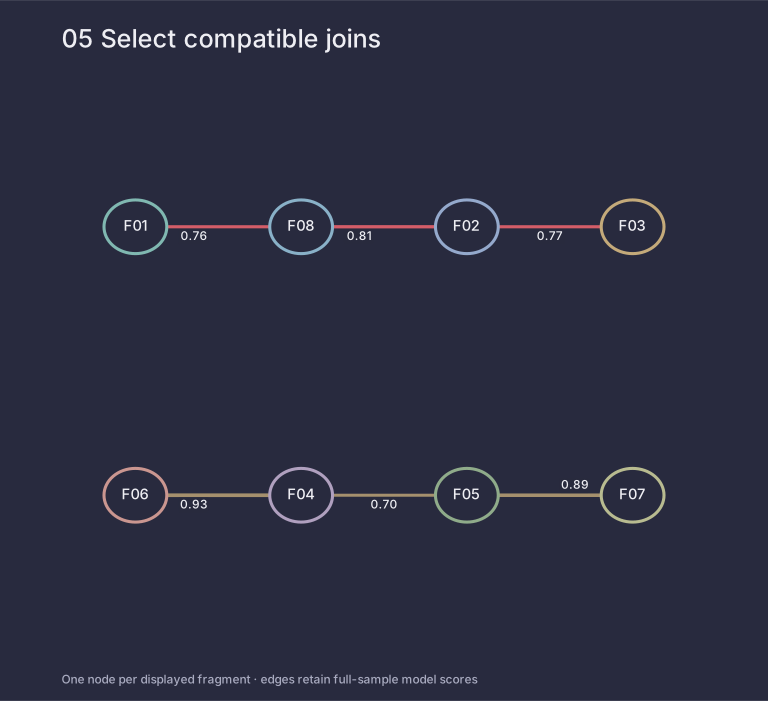
Genome curation, step by step1. Contact map: Hi-C contacts between eight genome fragments from a real sample. Darker red means more contact. 2. Pair features: Each candidate pair’s contact patch and its four corner crops pass through a frozen ViT-MAE, one vector per view. With four pair scalars, they describe that pair. 3. Fragment graph: The 14 candidate pairs become edges carrying those features. Each fragment becomes a node with six fragment properties. 4. Graph model: A graph neural network passes messages between neighbouring fragments along the edges. 5. Join scores: The model scores how likely each pair is to be direct neighbours. 6. Compatible paths: Strong joins are kept only if their ends are free. F01–F02 loses because one of its ends is already taken, leaving two paths. 7. Reassembled map: Fragments are reordered and flipped along the paths. For this excerpt the result matches the curator’s reference.F01 +F02 +F03 +F04 +F05 +F06 +F07 +F08 +F01 +F02 +F03 +F04 +F05 +F06 +F07 +F08 +F01 +F08 −F02 +F03 −F06 −F04 +F05 −F07 +F01 +F08 −F02 +F03 −F06 −F04 +F05 −F07 +F01 × F08 patchwhole + 4 cornersViT-MAEfrozen+ 4 pair scalarsfeatures of edge F01–F080.580.250.000.760.770.810.150.700.930.030.210.890.010.07✕ end already usedF01F02F03F04F05F06F07F08GATv2 → NNConv → join + end heads
1 / 7Contact mapHi-C contacts between eight genome fragments from a real sample. Darker red means more contact.

From contact evidence to compatible paths

Selected real-data examples, not benchmarks. Eight displayed fragments are an excerpt of a larger model computation.

1. Contact evidence
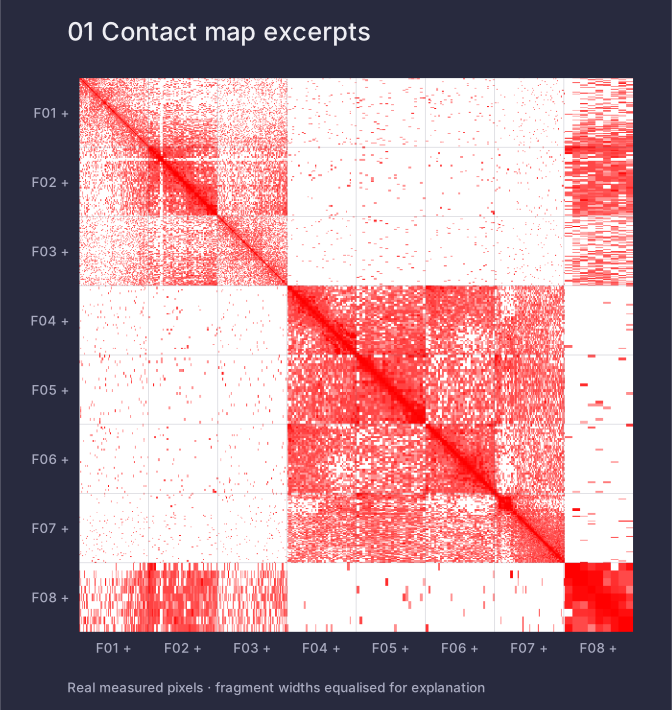
Contact-map excerpt with fragments F01 to F08. Red shows stronger measured contact; white indicates zero signal.
Hi-C measures contact between genome regions. Display widths are equalised; omitted regions and fragment sizes are simplified.

2. Candidate graph

Eight fragment nodes connected by 14 retrieved candidate edges, which are pairs to score rather than confirmed neighbours.
Contact intensity selects candidate pairs before image encoding. This demonstration was scored on the full sample's retrieval-only graph, separately from the historical validation run.

3. Learned join scores

Learned join scores include 0.76 for F01 to F08 and 0.58 for the competing F01 to F02 edge.
Frozen ViT-MAE image features feed a graph model. One head scores immediate adjacency; another predicts meeting ends, trained only on true joins. Scores are predictions, not confirmed joins.

4. Compatible paths

Six accepted joins form paths F01, F08, F02, F03 and F06, F04, F05, F07; the competing F01 to F02 edge is rejected.
An illustration-only decoder ranks join/end scores and rejects reused ends or cycles. It obtains order and relative orientation without reference labels. These selected paths do not demonstrate complete autonomous curation.

On mobile, swipe diagrams or focus with Tab and use the arrow keys.

Recorded validation

Join F1
0.631
Validation samples
98
Threshold
0.5

Candidate scoring, not assembly accuracy. Main validation force-includes eligible reference joins. This single-seed, validation-selected result is not independent test performance. Retrieval-subset scores use augmented-graph predictions and are not independently verified inference performance.

My contribution

Data preparation → image features → graph models → training and evaluation → iterative experiments → stakeholder feedback.

Experiments were tracked in MLflow and compared run by run to guide model and data changes. Progress was presented regularly to curators from Darwin Tree of Life and the Vertebrate Genomes Project, bioinformaticians and AI engineers at Rockefeller University, and the Google AI genomics team, and their feedback shaped the next steps.

Engineering details
  • Traceable data: canonical pair IDs, versioned records, atomic writes, and recorded exclusions.
  • Model design: five ordered image views, graph message passing, and pair/multi-view baselines. Pretrained ViT-MAE, Hugging Face Transformers, PyTorch, and PyTorch Geometric remain third-party components.
  • Evaluation: train-only normalisation; separate join and conditional-end metrics; stop on out-of-memory errors rather than silently dropping candidates.
Back to projects